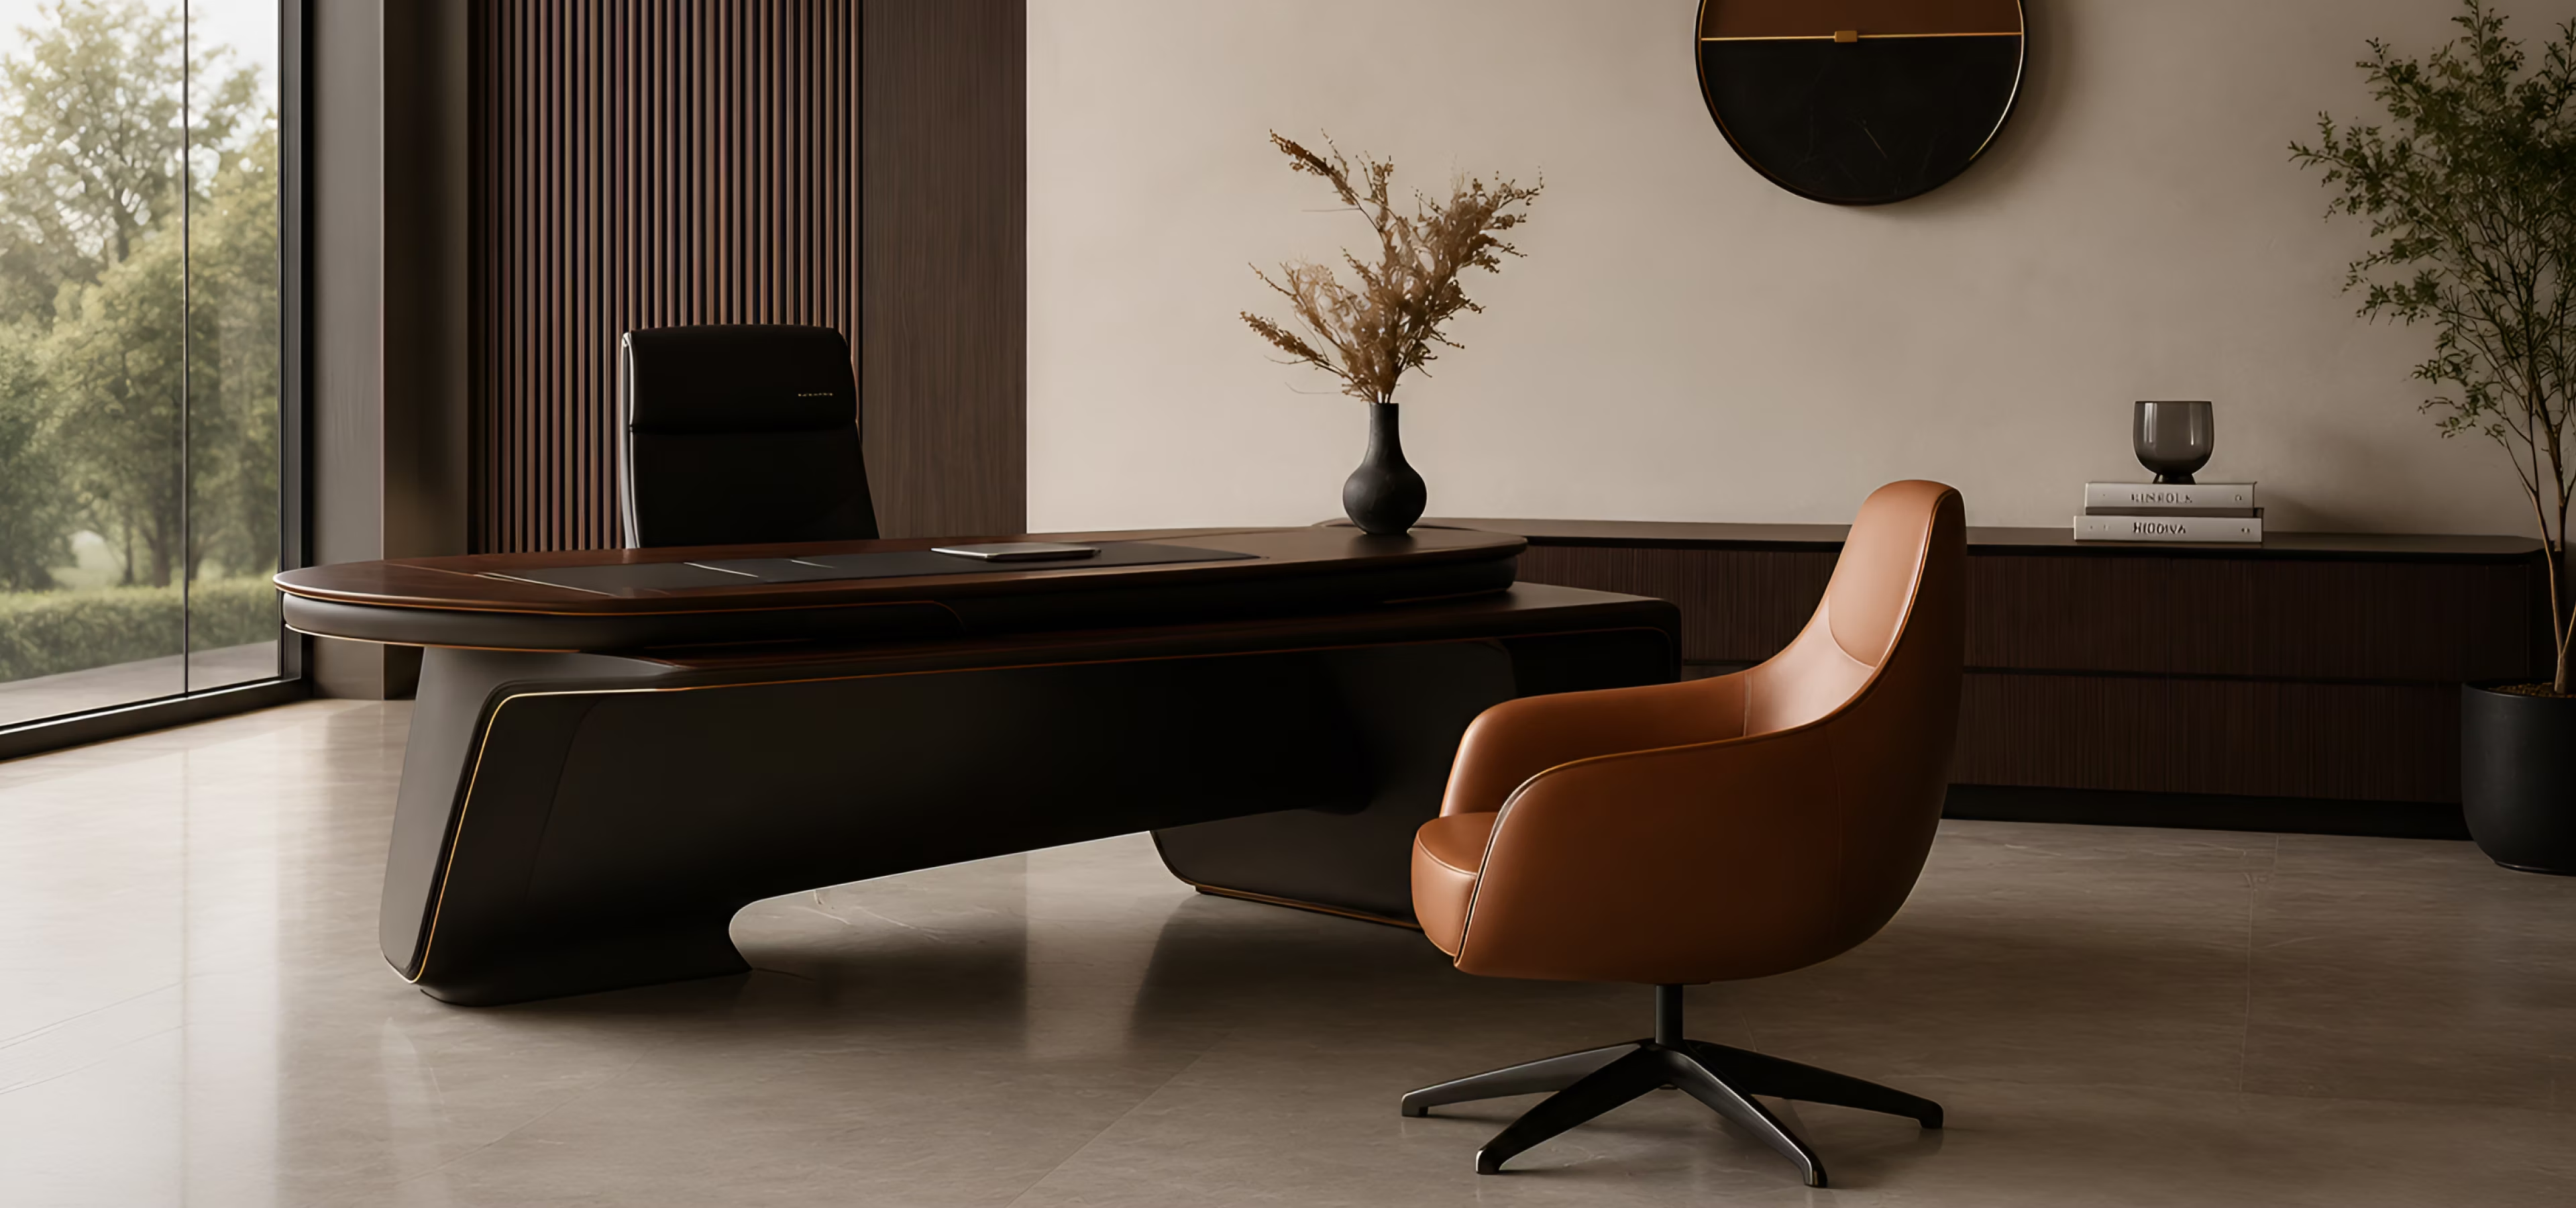
Modern office interior featuring a large dark wood desk with a black office chair behind it, a brown leather swivel chair in front, a black vase with dried plants on the desk, a wall clock, and a sideboard with books and a decorative glass, all set against a light beige wall and a large window revealing green trees outside.
Case study

Style guide

Explore the template’s core styles, typography, colors, spacing, and reusable components for easy customization.

Colors
Accent 900
#21161a
Accent 800
#372426
Accent 700
#402b2d
Accent 600
#a94454
Accent 500
#d3c6b1
Accent 400
#8e676b
Accent 300
#cda2a7
Accent 200
#d9c0c3
Accent 100
#eee0d5
Neutral 500
#000000
Neutral 400
#4a4a4a
Neutral 350
#cfc0c2
Neutral 250
#ede4d7
Neutral 200
#faf2e9
Neutral 150
#dfdfdf
Neutral 100
#faf2e9
Typography
Size
Line height
Weights

H1

4.375rem
110%
400

H2

2.875rem
115%
400

H3

1.875rem
115%
400

H4

1.4375rem
125%
400
H5
1.25rem
130%
400
H6
1.125rem
125%
400

Body font

1.0625rem
150%
400
Logo
Favicons
Zeneth-favicon-small
Abstract white geometric shape resembling a stylized letter Z on a dark purple background.
Brand logo
zeneth-logo-black
zeneth-logo-white
Buttons
Button style one
Button style one
Avatars
contact-avatar-image
5 rem
Placeholder
Thank you! Your submission has been received!
Oops! Something went wrong while submitting the form.
Thank you! Your submission has been received!
Oops! Something went wrong while submitting the form.
States messages
Thank you! Your submission has been received!
Rich text

Where it started

Alderbrook had grown rapidly across multiple facilities, but its operational processes had not kept pace. Manual workflows, inconsistent reporting, and duplicated tasks were creating delays across key functions, while rising operating costs were putting pressure on margins.

The leadership team initially considered adding more resources to handle the growing workload. We suspected the real constraint was operational efficiency, not capacity — and the numbers backed that up.

What we did

We began with a full operational diagnostic — mapping core workflows, resource allocation, process bottlenecks, and performance metrics across the business. That analysis highlighted several areas where manual steps and fragmented processes were slowing execution and increasing costs.

In parallel, we identified $1.3M in operational inefficiencies — primarily from duplicated workflows, underutilized resources, and inconsistent processes — and built a streamlined operating model focused on automation, accountability, and measurable performance improvement.